Discover how Texas real estate in 2026 shifted from “always hot” to “selectively hot,” with new flood maps, tax reforms, and hyper-local data reshaping investor strategy.
The era of the "Texas Monolith" has reached its expiration date. For a decade, the narrative surrounding the Lone Star State was one of unyielding heat—an "always hot" market where demand was a blunt instrument that leveled all nuances. However, as we navigate 2026, the data-driven reality is far more fragmented. The market has shifted from a singular boom to a "selectively hot" landscape defined by meaningful volatility.
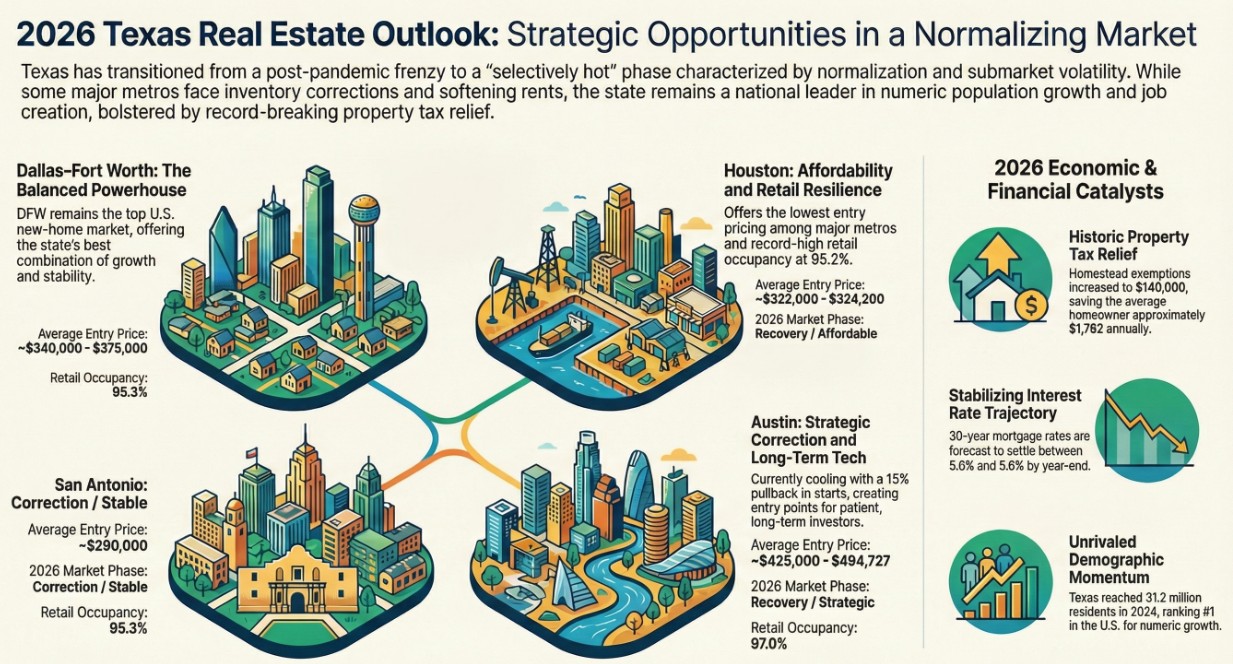 Sophisticated investors are currently looking past the "choppiness" described by industry leaders like Bryan Glasshagel to identify the signals within the noise. While late 2025 closed with an 8% year-over-year decline in statewide home sales, the Texas Real Estate Research Center (TRERC) projects a 2.5% rise for 2026. This is not a return to the pandemic-era frenzy; it is a transition into a normalization year where macro-level stability masks intense local divergences. To succeed in this environment, one must discard the broad headlines and master the counter-intuitive takeaways of the 2026 data.
The Flood Map Fallacy: Why Your "Zone" Is Not Your Destiny
For the sophisticated investor, the traditional reliance on FEMA’s "Zone X" has become an expensive liability. On February 10, 2026, FEMA released draft flood maps for Harris County—the first comprehensive update since 2007. Utilizing advanced LiDAR terrain data, these maps recalibrated the "100-year" rainfall estimate from 13 inches to 17 inches within a 24-hour period.
"According to a Houston Chronicle analysis, the 100-year floodplain would grow by about 130 square miles, a 43% increase."
The fallacy lies in the assumption that a "low risk" designation equates to lower costs. Under Risk Rating 2.0, map lines are essentially relics of 2007; premiums are now determined by property-specific data. The most staggering "signal" in the Harris County data is this: 7 of the 17 "Low Risk" (Zone X) properties in a recent portfolio analysis actually pay more than the lowest-priced "High Risk" (Zone AE) properties.
The number that should stop you: A "low risk" property in Southeast Houston (Zip 77089) currently carries a premium of 1,666**, while a "high risk" property in Kingwood (Zip 77345) costs only **432. In 2026, the burden of due diligence has shifted from checking a map to analyzing individual property elevation and loss history.
The Austin Reset: From Pandemic Darling to Strategic "Patient Play"
Austin is the outlier of the Texas market, currently enduring a necessary correction after its pandemic-era overheating. To understand the current -3.6% year-over-year price decline, one must contrast it with the unsustainably sharp peaks of 2021 (+35%) and 2022 (+15%). With housing starts down 15%, the city is working through a massive oversupply of new construction.
The current Zillow average home value of $494,727 reflects a market where the "Return-to-Office" (RTO) trend has become a genuine headwind for a city that grew on the back of remote tech workers.
"Redfin’s 2026 housing market predictions specifically name Austin as one of the markets most likely to cool further this year, pointing to insurance costs, natural disaster risk, and the reversal of pandemic-era remote work patterns."
Austin is no longer a "beginner market." It has evolved into a strategic long-term play. While it remains a high-potential tech hub with strong fundamentals, the 2026 reality demands investors who can withstand soft short-term rent growth and maintain the reserves to outlast the current inventory surplus.
The $1,762 Tax Jackpot: Texas’s Record-Breaking Relief
For years, Texas property taxes were the "hidden" cost that balanced the lack of state income tax. In 2026, that equation has tilted in favor of the homeowner through the largest combined savings in state history. While voters approved Proposition 13 in November 2025, the full implementation of these reforms is the primary driver of 2026's consumer sentiment.
The $1,762 Total Combined Savings for the average homeowner is distilled through three legislative levers:
- SB 4 (Homestead Exemption): An increase in the mandatory school district exemption from 100,000 to 140,000.
- SB 23 (Senior/Disabled Exemption): A dramatic increase in the additional senior exemption from 10,000 to 60,000, creating a combined $200,000 school tax shield and strengthening the "Senior Freeze."
- HB 8 (Rate Compression): A temporary school tax rate cut of $0.0331 per $100 of value.
The journalist’s insight here is that while these exemptions lower taxable value, they do nothing to lower the appraised base. Therefore, protesting appraisals in 2026 remains a high-value activity; a successful protest lowers the base upon which these record-breaking exemptions sit, compounding the savings across all taxing entities.
The Commercial Paradox: Retail’s Record Rise vs. Office’s Space Race
The Texas commercial sector is defined by a shocking "decoupling" of labor and square footage. Statewide, 53 million square feet of vacant office space has accumulated over the last five years. However, this is not due to a lack of hiring. Office-sector jobs in Austin rose by 8% and DFW by 15% through late 2025.
The paradox is that while hiring is up, the space absorbed per employee has crashed by over 50%. Remote-work dynamics have made office square footage an optional luxury rather than a corporate necessity.
Conversely, Texas retail is hitting record occupancy, with Austin leading at 97%. The "secret weapon" is grocery-anchored development. Giants like H-E-B and Lowe's are driving 2026’s retail tightness, as limited new supply and the necessity of physical retail in growth corridors keep vacancy at historic lows, even as office landlords face a grim struggle for equilibrium.
The "Hyper-Local" Secret: Why the City is a Distraction
In 2026, "buying Texas" is a lazy strategy. Successful capital allocation now requires "buying a growth path." City-wide headlines are distractions that mask intense submarket variation.
For example, in the DFW metroplex, the headline may show a 4.1% decline, but this is heavily skewed by a surge of new-build inventory in outer suburbs like McKinney and Frisco. Meanwhile, supply-constrained inner neighborhoods such as Lake Highlands and East Dallas remain extremely tight with strong pricing resilience. According to the data, the factors that drive 2026 success are:
- Precise school zone boundaries.
- Rental pockets within employer corridors.
- Neighborhood-specific inventory levels.
Winning in 2026 requires ignoring the metropolitan average and focusing on the zip-code level data where local demand often defies regional cooling trends.
Conclusion: The Long Game in a Choppy Market
Despite the volatility, the 2026 outlook for Texas is one of normalization. The state has hit a population of 31.2 million, and as mortgage rates settle into the 5% to 5.6% range, the market is finding its floor.
Texas is no longer a market where a rising tide lifts all boats. In a "normalization year" where "low risk" labels are expensive liabilities and pandemic boomtowns are in the midst of a reset, the question for the modern investor is simple: Are you still investing based on yesterday’s headlines, or today’s data?
Written by
Under500K Team
Research and market insights for global property investors.