
Charlotte’s 2026 under-$500k market blends 7–9% gross yields, strong job growth, and future transit premiums, creating a rare ROI window for long-term investors.
-
The Hook: Why "Slow Growth" is Charlotte’s Secret Weapon
The national economic narrative of early 2026 is defined by "slow growth" and resilience, with a persistent 3.3% inflation rate fueling widespread market jitters. However, for the disciplined investor, Charlotte represents a rare decoupling from this national malaise. While peer metros face stagnation, the Queen City has solidified its position as the #1 metro for job growth in the U.S., adding 39,200 positions—a 2.8% year-over-year expansion.
This engine is sustained by a relentless human capital migration of 157 new residents daily. In this environment, "slow growth" isn't a sign of weakness; it’s a stabilizer. It has allowed the market to absorb recent supply while demand drivers remain at historic highs, creating a strategic entry point for those who understand that population density eventually mandates price appreciation.
-
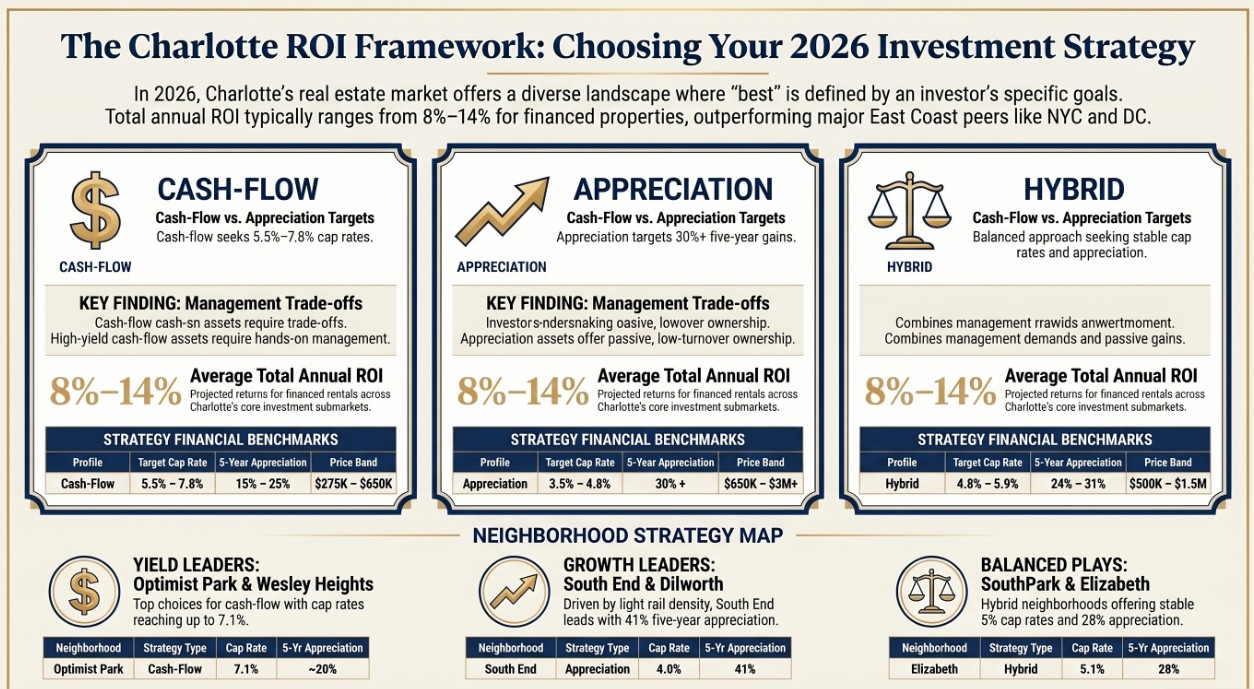
Yield Over Everything: The Rise of the "Cash-Flow Leaders"
As coastal "trophy assets" struggle to reach break-even, Charlotte’s emerging urban corridors are producing aggressive monthly net income. For the yield-focused investor, the current market has clearly bifurcated, with a handful of neighborhoods outperforming the metropolitan average.
- Enderly Park: 7.8% Cap Rate (9.0% Gross Yield)
- Optimist Park: 7.1% Cap Rate (9.2% Gross Yield)
- LoSo (Lower South End): 6.6% Cap Rate (8.5% Gross Yield)
- Wesley Heights: 6.4% Cap Rate (8.2% Gross Yield)
It is critical to note that yield and management intensity are positively correlated. High-yield plays like Enderly Park require a "hands-on" approach. Beyond simple oversight, these assets carry meaningfully higher tenant turnover and significant capital expenditure (capex) risk. Investors must underwrite for these specific "capex risks" to protect their pro-forma returns. Despite these requirements, the performance gap remains significant:
"Total annual ROI (cash flow + appreciation) at Charlotte 2026 pricing typically lands 8%–14% on financed rentals... This outperforms most East Coast peer metros (NYC boroughs 3%–6%, Boston 5%–7%, DC 4%–7%)."
-
The Transit Premium: South End’s 41% Appreciation Trap?
Appreciation-profile investors in 2026 are playing a different game, often accepting negative or break-even cash flow for 12–36 months to capture long-term capital gains in constrained submarkets. The primary driver of this strategy is the "Transit Premium." Properties within a half-mile of the LYNX Blue Line have historically demonstrated a 15–25 percentage point appreciation advantage over comparable assets without rail access.
South End remains the city’s appreciation leader with a staggering +41% five-year gain, followed by Dilworth at +38%. Even luxury mainstays like Myers Park (+33%) lag behind the urban core’s density-driven growth. For the HNW investor, the South End "trap" is only a risk if the horizon is short; for those with a 5-year outlook, it remains the ultimate bet on corporate relocation density.
-
The 1031 Arbitrage: Turning NYC Equity into Charlotte Cash
Charlotte has evolved into the premier destination for 1031 exchange investors exiting high-tax coastal environments. The "tax arbitrage" effect is perhaps the most compelling mathematical argument for the region. By redeploying equity from states like New York or California into North Carolina, investors move from double-digit income tax brackets to a 3.99% flat income tax.
Furthermore, the holding costs are significantly lower. The combined property tax rate for the City of Charlotte and Mecklenburg County is approximately 0.7668%—one of the most competitive rates in the Sun Belt. When a 1.2M rental is moved from NYC to Charlotte, the combination of a 2-3 percentage point cap rate improvement and tax relief results in an immediate Net Operating Income (NOI) increase of roughly 24,000 annually.
-
The Silver Line Speculation: Investing in the 2040 Policy Map
Strategic investing in 2026 requires a 2030 horizon. While the LYNX Blue Line has already priced in its gains, the LYNX Silver Line and the CLT Airport Expansion (2028) represent the next frontier.
The Charlotte Future 2040 Policy Map provides the blueprint for this expansion. However, we must distinguish between investment and speculation: short-horizon plays in these corridors are purely speculative. The "2040" thesis is a long-dated play, requiring investors to hold assets through the construction phases to capture the eventual transit-oriented development premium.
-
The STR Truth: It’s Zoning, Not a Ban
The regulatory landscape for Short-Term Rentals (STRs) in Charlotte is often misunderstood. The city does not utilize a standalone licensing regime; instead, it employs a "zoning-first framework" under the Unified Development Ordinance (UDO).
In submarkets like South End or Plaza Midwood, STRs can deliver 1.5x–2.2x the gross yield of long-term rentals. However, operational risk is rising. Investors must be wary of potential regulatory tightening in 2027, specifically regarding non-owner-occupied restrictions. Eligibility is determined strictly by the property’s specific zoning district, and any shift in the UDO could compress yields for those who haven't underwritten their assets to "pencil out" as long-term rentals in a downside scenario.
-
Industrial Momentum: The Silent ROI of the "Big Box" Shortage
The most overlooked indicator of residential market health is Charlotte’s industrial sector. The current industrial vacancy rate has tightened to 7.7%, and notably, only one "big-box" availability above 500,000 sq. ft. remains in the entire metro.
This logistics scarcity underpins the entire residential market in the "Airport" and "Southwest" submarkets. The Airport submarket specifically saw a 410 bps decrease in vacancy this quarter, driven by anchor tenants like Amazon and Atrium Health. As these industrial giants expand their footprints, they create a permanent floor for rental demand in the surrounding residential corridors, insulating those neighborhoods from broader market corrections.
-
The Under-$500k Sweet Spot: Where the "Correction" Meets Opportunity
For the mid-tier investor, the current market correction has created a target-rich environment in the sub-500k segment. With a median entry price of 420,000 and an average gross yield of 6.8%, this segment carries an 82% confidence buy verdict due to its ties to finance, tech, and healthcare employment.
- Windsor Park: A core target for single-family rentals with 7% yield potential.
- Eastland: Classified as a T1 Target with exceptionally high yield potential in a revitalizing corridor.
- University City: A resilient market anchored by higher education and tech-driven demand.
-
Conclusion: The Forward-Looking Investor’s Question
In 2026, the successful investor must find "Goldilocks places." These are the neighborhoods—such as Sedgefield or Montford—that possess the viable potential to attract market-driven investment while remaining in that strategic "sweet spot": they need the market accelerant to reach their peak but are not yet so overpriced that they offer no upside.
Success in Charlotte requires surgical submarket selection. As you evaluate your 5-year horizon, you must ask: Are you satisfied with securing the yield leaders of today, or will you position your capital to capture the massive transit premium of 2030?
For additional details check the full city report for Charlotte, NC: https://www.under500k.ai/app/reports/charlotte-united-states-20260515-134834
Written by
Under500K Team
Research and market insights for global property investors.